Extension 3.5: Data Sorting and Analysis (5 points)
Authors
Brennan Morell
Jarett Gross
A big part of Computer Science revolves around finding ways to sort data to be organized in a useful manner. There are many different algorithms that computer scientists use to sort information. You can learn about a few popular ones below:
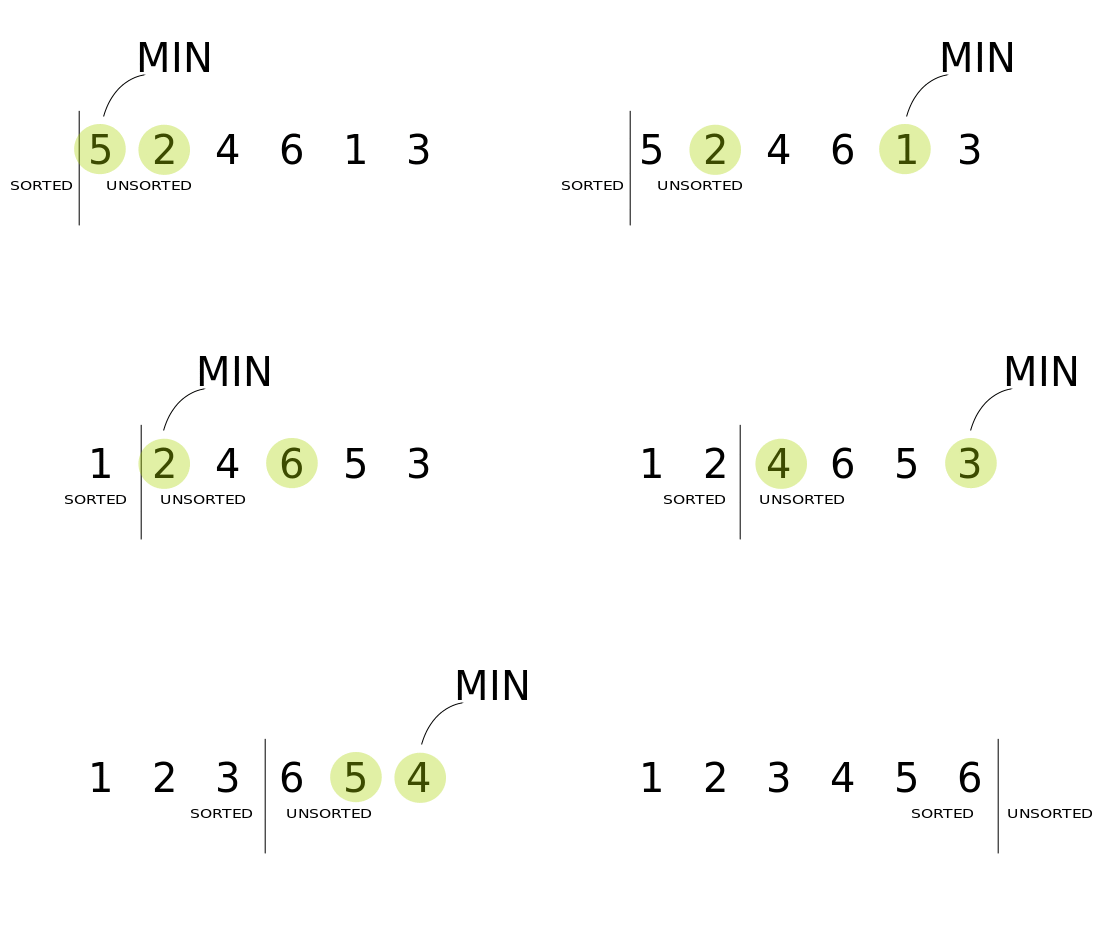
We will implement our sorting using a naive process of repeatedly selecting the smallest value from a data set of type int[] and swapping it to the front of the collection. In computer science, this is called a Selection Sort.
Procedure
Open the
Sortingclass, found in thearrayspackage of theextensionsfolder.Prompt the user for the
sizeof the collectionIf the user enters a negative number, continue to prompt them with a useful message until they enter a positive number.
Continue to prompt the user to input numbers one at a time, using an array to store the input data.
After processing all of the numbers entered, the data will be sorted using the following naive algorithm:
Create an outer loop to limit the number of scans to be equal to the size of the collection.
Create an inner loop to iterate over the unsorted portion of the array, each time selecting the minimum value (keep track of this value and its index in the array)
The unsorted portion will always be the sub-array with indexes
sortCounttosizeinclusive.Swap this minimum value with the value currently at the head of the unsorted portion of the array

Please note that you cannot reuse your code from Assignment 3 because this is a different algorithm.
After the sorting the data, we will take advantage of its useful organization to compute the following statistics:
Mean: The simple average of the data.
Median: The middle value in the ordered dataset (Note: How does this computation vary for even and odd sized datasets?)
Min: The smallest value in the ordered dataset.
Max: The largest value in the ordered dataset.
Range: The difference between the maximum and minimum values of the data set.
Finally, arrange for your output to display the sorted dataset and accompanying statistics in the following manner:
1 2 3 4 5
Mean: 3.0
Median: 3.0
Min: 1
Max: 5
Range: 4